
Authors
Turquoise's Payer Transparency scores represent our effort to gauge the relative quality and completeness of payers' Machine Readable Files after years of ingesting and using their data. These are intended as a tool to help improve this data nationwide and make it as easy to use as possible.
This article outlines our detailed scoring methodology so that payers can investigate themselves and improve their data with as little friction as possible.
Turquoise Health is not the arbiter of compliance to the Transparency in Coverage rule. These scores do not represent an attempt at determining payer compliance to this rule.
Setting the Scene
Before we get into the weeds, here are some points to give general context on our scoring method as a whole:
Transparency Scores update each month, around the beginning of each month. For example around 10/1/25, you'll see the scores update with data from August 2025.
At the moment, we have only scored payers on their reporting of rates for Hospitals and Ambulatory Surgery Centers (ASCs).
For each payer, we've scored a single product / network that we find and expect to be most representative of the dataset as a whole. For example for national payers, we may choose their largest national PPO network.
For each payer, scores are calculated at an individual Provider level before being rolled up to the State and finally overall Payer levels (used for each payer's Ranking).
For now, the Payer Transparency Scores only include the largest payers whose improvement in data quality would have the largest impact across the industry, and is not a comprehensive account of all the payer files Turquoise currently ingests.
Based on our own knowledge of the files, comparing payers relative to each other, and analysis of our own scoring system, we've categorized all scores into the following ratings:
- Excellent: Data is within the bounds of quality and completeness that we expect, and have met the standards of usability.
- Good: Data is usable and reasonable, with some minor gaps. Could still use some improvement.
- Fair: There are noticeable gaps in the data that should be addressed in order to achieve the quality and completeness we expect.
- Poor: The data is more incomplete than complete, and needs attention in order to be usable.
- Missing: No data was reported.
Now let's get into how scores are really calculated!
The Key Metrics
We've shown these percentages front-and-center for each payer, as they can provide a quick glance at issues that may be affecting the quality -- and as a result scores -- of their files.
Parsability
Parsability indicates the percent of files Turquoise was able to ingest from this payer, this month. We only score a single network's data from the files we are able to ingest. But a low parsability percentage may indicate the files with the largest network were not able to be ingested and used in our scoring.
Our pipelines are able to ingest all compliant files from each payer with very high consistency each month. If we were unable to parse a file, it is likely but not certain that there was an issue with the file or website itself.
Conflicting Rates
Conflicting rates are records where a single service has multiple, distinct rates reported, with no way to differentiate between them. Here's a simplified example:

These rates are considered invalid and not counted towards a payer's score. A high conflicting rate percentage is a major indicator of why a payer's scores may be low.
Scores at all levels (state and provider) are limited if Conflicting rate percentages exceed a certain threshold. Any provider or state with >= 25% Conflicting rates will not be able to receive a score greater than 'Good'. Likewise, any provider or state with >= 50% Conflicting rates will not be able to receive a score greater than 'Fair'
Outlier Rates
The percentage of rates that were deemed outliers, and thus counted not towards a payer's score.
It's reasonable for this percentage to be above 0 -- it inevitably happens in most files. But the higher the number is, the more likely it is that these Outliers are significantly affecting a payer's scores.
The same 'limiting' logic described above for Conflicting rates applies to Outlier rates. Any provider or state with >= 25% Outlier rates will not be able to receive a score greater than 'Good'. Likewise, any provider or state with >= 50% Outlier rates will not be able to receive a score greater than 'Fair'
The methodology for determining this is explained in the 'Determining Quality' section below.
The Building Blocks
Before determining scores, we have to decide our 'denominator'. The providers -- and codes for those providers -- we'd reasonably expect each payer to report.
Providers
Note: We know that some providers are non-contracted with payers in their market. That's why a single missing provider will not have a major impact on a payer's score.
Hospitals
We expect data to be posted for all General Acute Care hospitals (defined by their NUCC taxonomy) based in counties / states that a payer operates in. If no data is posted for one of these hospitals, they receive a score of 0 for that payer.
Ambulatory Surgery Centers (ASCs)
We expect data to be posted for all ASCs (defined as providers reported in CMS's latest ASC Supplier file) based in counties / states that a payer operates in. If no data is posted for one of these ASCs, they receive a score of 0 for that payer.
Codes
Note: This is just a possible list of codes we're looking for. We don't expect every payer to report every one of these codes.
For more detail on how these code categories feed into larger scores, see the "Provider-Level Scores' section below.
Hospitals
Linked here, you will find the full list of codes expected for each Code Category.
Briefly, here's our logic for each Category:
- MS-DRGs: All MS-DRGs from the most recent IPPS version.
- APR-DRGs: All APR-DRGs.
- Inpatient Revenue Codes (Room and Board / ICU / NICU): Each revenue code is bucketed into one of eight categories: Med/Surg/General, OB, Pediatric, Psychiatric, Detox, Rehab, ICU, and Nursery. Payers receive full credit for a category if they report at least one code within it.
- Surgical HCPCS: All HCPCS between 10000 and 69999 with status indicators J1, J2, S, T, Q1, Q2, Q3, G, or K per the latest OPPS Addendum B file.
- Surgical Revenue Codes: All 36X revenue codes.
- Non-Surgical HCPCS: All other HCPCS with status indicators J1, J2, S, T, Q1, Q2, Q3, G, or K per the latest OPPS Addendum B file, plus all Evaluation and Management HCPCs.
- Non-Surgical Revenue Codes: All 32X, 33X, 34X, 40X, 45X, 48X, 63X, 72X, and 73X revenue codes.
- EAPGs: All EAPGs are included in the 'expected' list.
- APCs: All APCs associated with HCPCS with the Status Indicators J1, J2, S, T, Q1, Q2, Q3, G, or K, per the latest OPPS Addendum B file.
For more detail on how these code categories feed into larger 'Inpatient' and 'Outpatient' scores, see the "Provider-Level Scores' section below.
Ambulatory Surgery Centers (ASCs)
Linked here you will find the full list of codes expected for each code category.
Briefly, here's our logic for each category:
- Surgical HCPCS: All expected codes come from the latest ASC Addenda AA file from CMS. From these codes, we use AMA's CPT Hierarchy descriptions to determine the surgical specialty they fall under.
- EAPGs: All EAPGs are included in the 'expected' list.
For more detail on how these code categories feed into the larger 'ASC' score, see the "Provider-Level Scores' section below.
Determining Quality
There are two reasons a rate might not count towards a score:
Outlier Rates
These are rates whose value we've deemed to be implausible, and thus not counted towards a payer's score.
Below is the full list of criteria that would result in a rate being marked as an Outlier:
- If the reported negotiated_type = 'per diem' and:
- rate > IPPS Medicare rate / IPPS's geometric LOS * 10
- rate < IPPS Medicare rate / IPPS's geometric LOS
- If the reported negotiated_type = 'percentage' and the rate > 100
- If the reported negotiated_type is one of 'derived','fee schedule',or 'negotiated' and rate > $500 and:
- negotiated_rate < 10% or > 1,000% of the applicable Medicare rate (using IPPS, OPPS, or ASC pricers)
- If the reported negotiated_type is one of 'derived','fee schedule',or 'negotiated' and rate ≤ $500 and:
- negotiated_rate < 10% or > 5,000% of the applicable Medicare rate (using IPPS, OPPS, or ASC pricers)
- If billing_code_type is ‘HCPCS’ or ’APC’ and negotiated_type is one of 'derived', 'fee schedule',or 'negotiated' and negotiated_rate > $500,000
- If billing_code_type = ‘MS-DRG’ and negotiated_type is one of 'derived', 'fee schedule', or 'negotiated' and negotiated_rate > $2.5M
- If OP Surgical Revenue Codes (360 or 361) are reported with any negotiated_type except 'percentage'.
Conflicting Rates
Conflicting rates are records where a single service has multiple, distinct rates reported, with no way to differentiate between them. If a given code only has conflicting rates, that code is deemed as "not reported" and thus not counted towards a score.
If any rates have been discounted as Conflicting or Outliers, you'll see this "Warning" indicator in the provider-level drawer:

Provider-Level Scores
We now have the full list of expected codes and providers, as well as the rates that will or will not count towards a score. But how do these components come together into a singular score for each provider?
Code Category Scores
Within each code category, we determine whether there was a single, non-conflicting, non-outlier rate for each code. All codes that qualify are divided by the total expected count to determine that category's score.
For example:
Payer reports 400 / 700 MS-DRGs for General Community Hospital.
Of those 400 MS-DRG, 50 are discounted as Outliers for having a rate of $100M.
350 / 700 = an MS-DRG Score of 50%.
Now we can fit code category scores together to roll up to simpler, aggregated scores.
Hospitals
Our scores only take into account rates marked with Billing Class = 'Institutional' or 'Both'. All hospital rates marked as 'Professional' do not count towards a payer's score.
Outpatient
The three major Code Categories used in Outpatient scoring are HCPCS / Revenue Codes, APCs, and EAPGs.
First, an overall HCPCS / Revenue Code Score is calculated with some simple averaging of subsets of Code Categories:
- Surgical HCPCS Score + Surgical Revenue Code Score = Surgical HCPCS Revenue Code Score
- Non-Surgical HCPCS Score + Non-Surgical Revenue Code Score = Non-Surgical HCPCS Revenue Code Score
- Average of Non-Surgical HCPCS Revenue Code Score and Surgical HCPCS Revenue Code Score = HCPCS Revenue Code Score
We then add the HCPCS / Revenue Code Score to the provider's APC Score and EAPG Score to yield the final Outpatient Score.
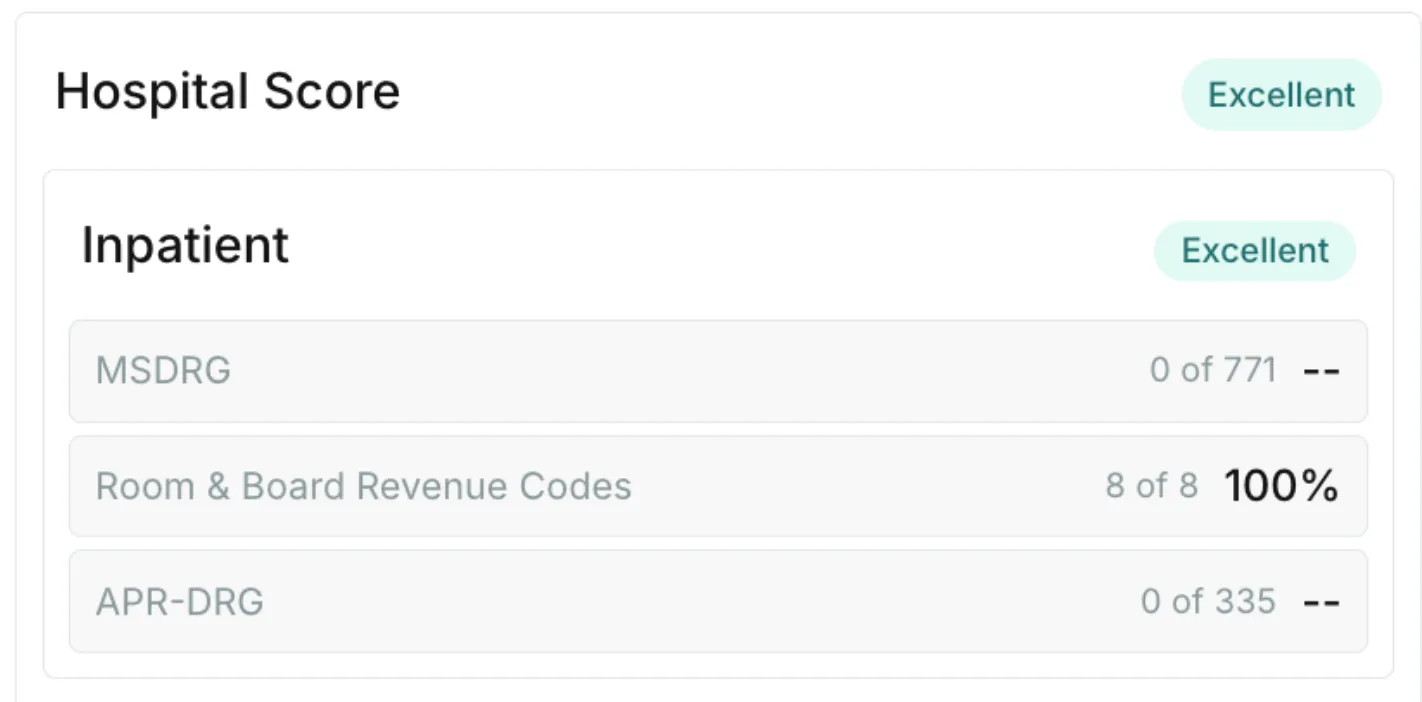
Inpatient
Adding together a provider's MS-DRG Score, Room and Board Revenue Code Score, and APR-DRG Score yield the final Inpatient Score.
Capitated Rates
We wanted to be able to account for capitation-based contracts fairly. If only capitated rates are reported by a payer for a given provider, they receive a 100% score by default.
"Custom-All"
Similar to capitated rates, we know that some payer-provider contracts operate off of much simpler, global percent-of-charge reimbursement.
These cases are often represented by a single code in the data, where billing_code_type = 'CSTM-ALL' (Custom - All) and billing_code = 'CSTM-ALL'. As a catch-all single record. We have followed CMS's guidance here for what we classify as a valid 'CSTM-ALL' code.
If only Custom-All is reported by a payer for a given provider, they also receive a 100% score by default.
Finally, the Overall Hospital Score is simply an average of a hospital's Outpatient and Inpatient scores. If these scores are 0, but "All Capitated Rates" or "Custom-All" are found to be True, the hospital receives a default 100% score.
Click on any hospital's scores to view a breakdown of its category-level scores:
Ambulatory Surgery Centers (ASCs)
For ASCs, we first calculate a Surgical HCPCS Score.
We know that not all Ambulatory Surgery Centers can be expected to provide every surgical procedure list in CMS's Addenda AA file. To account for this, we've split these HCPCS into the following categories:
- Auditory Surgery
- Cardiovascular Surgery
- Endoscopic Surgery
- Opthalmologic Surgery
- Gastrointestinal Surgery
- Dermatology Surgery
- Nervous System Surgery
- OB/GYN Surgery
- Orthopedic Surgery
- Podiatric Surgery
- Urology Surgery
If any code from one of these Categories is reported by a payer, we then expect all codes from that category to be reported. As an indication that this ASC provides the procedures in that surgical category. We then take the average of all Categories for which codes were reported.
For example:
Payer reports 100 / 200 codes from Gastrointestinal Surgery and 100 / 100 codes from Endoscopic Surgery for GI Center of Community.
This means a 50% score for Gastrointestinal Surgery and a 100% score for Endoscopic Surgery. Averaging to a Surgical HCPCS score of 75%.
The overall Surgical HCPCS Score is then added to the EAPG Score to yield the final Ambulatory Surgery Score. Just like with hospitals, if these scores are 0 but "Custom-All" is found to be True, the ASC receives a default 100% score.
Click on any ASC's scores to view a breakdown of its category-level scores:

Rolling It Up
We now have scores for every single provider (both Hospitals and ASCs) for a payer.
For hospitals, a payer's State score is informed by provider weighting, based on each hospital's Net Patient Revenue. To reflect the fact that posting rates for certain key hospitals in a payer's region is essential to a complete, quality machine-readable file.
We sum the net patient revenue (NPR) of all hospitals we expect a payer to post within a state they operate in. The percentage of that overall NPR that each hospital represents becomes it's weighting towards the payer's score in that state.
For ASC's, a payer's State Score is calculated by simply averaging the scores across all 'expected' providers for this payer, in a given a state.
For any questions or concerns, please reach out to support@turquoise.health.
See inside the black box
Traceable data, unified workflows, and total transparency
Related resources
Learn, listen, and watch the latest on price transparency.

CMS’ new guidance puts stop loss on center stage
Celebrating official guidance on how to encode these complex terms into MRFs